| RUSSIAN VERSION |
MSU Subjective Comparison of Modern Video Codecs
MSU Graphics & Media Lab (Video Group)
Project head: Dr. Dmitriy Vatolin
Organization of assessment: Alexander Parshin, Petrov Oleg
Refinement, translation: Oleg Petrov
Verification: Alexander Parshin, Artem Titarenko
About comparison
Tested codecs:
- DivX 6.0
- Xvid 1.1.0
- x264
- WMV 9.0
Bitrates:
- 690 kbps
- 1024 kbps
Number of sequences: 4
Number of experts: 50
Download MSU Subjective Comparison of Modern Video Codecs (32 pages in PDF, 1.38 MB)
Goal of subjective comparison
During last few years many comparisons of video, audio and image codecs were carried out by our Graphics & Media Lab at Moscow State University. All of them used objective metrics like PSNR, VQM or SSIM. This fact has raised reasonable questions on adequacy of objective measures to the
subjectively perceived quality, which is the main parameter of a codec's performance.
Goals of our assessment are subjective comparison of new versions of popular videocodecs,
comparison of results with objective metrics and subjective assessment technology testing.
Main comparison parts:
- Subjective comparison of videocodecs.
- Comparison of results with objective metrics.
Subjective comparison
Main quality parameter for a codec - subjective impressions of a viewer of a compressed video.
Latter is the main idea of subjective comparison methods - quality score for a compressed sequence is the average opinion of a group of experts on its quality (MOS, Mean Opinion Score).
There are lots of methodologies of subjective assessment, many of them are implemented in
MSU Perceptual Video Quality tool
that was used for the assessment.
Our comparison is using SAMVIQ -
method that was recently developed by EBU (European Broadcasting Union), PDF with the comparison contains its description.
On a graph below you can see average MOS for all codecs, the higher the better. Probably, XviD results could be improved by switching on deblocking algorithm (this algorithm isn't used by default).
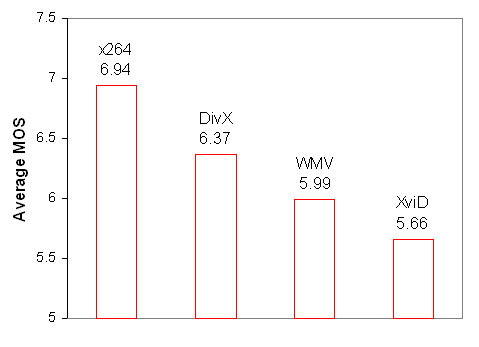 Average MOS for all codecs |
Following graph illustrates average MOS for each codec and bitrate and its' 95% confidence intervals.
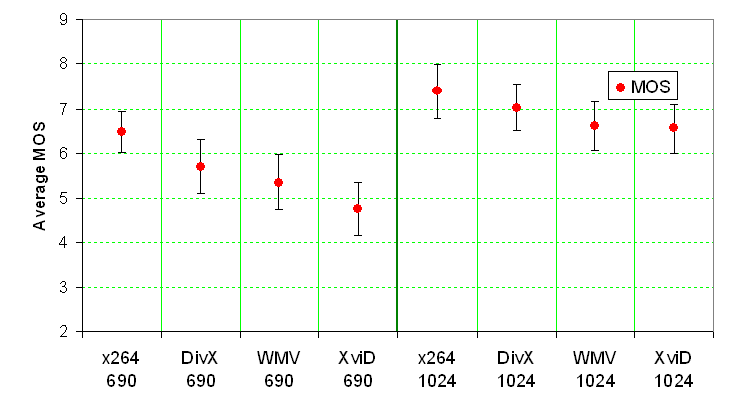 Average MOS for all codecs and bitrates |
Evaluation of objective metrics
PSNR, VQM and SSIM were measured for each sequence with MSU Video Quality Measurement tool, description of these metrics can be found on this page. Note, that "VQM" metric refers to algorithm of Feng Xiao, not proposed by VQEG objective quality metric. The following graphs illustrate relation between subjective opinion and an objective metric: if set of points is close to a straight line, then the metric is adequate to the subjectively perceived quality (values of PSNR and SSIM were mapped on MOS scale, see PDF with the comparison for more details).
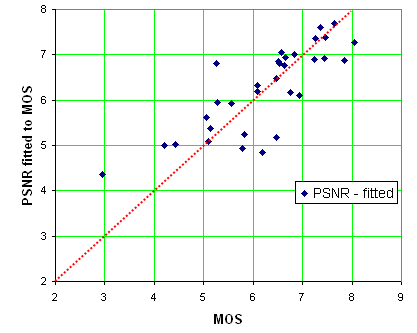
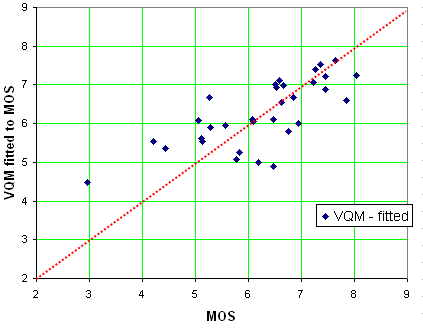
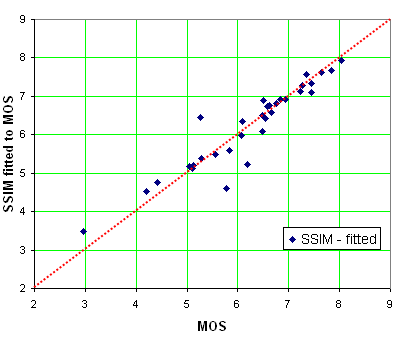
On our test set SSIM was far more adequate to the subjective opinion than PSNR and VQM
Content of HTML version
Download
- MSU Subjective Comparison of Modern Video Codecs - PDF (1.38 MB)
- MSU Subjective Comparison of Modern Video Codecs - ZIP (1.2 MB)
| E-mail: |  |
MSU video codecs comparisons resources:
- Introduction to Video Codecs Comparison
- Lossless Video Codecs Comparison 2004 (October 2004)
- MPEG-4 SP/ASP Video Codecs Comparison (March 2005)
- JPEG 2000 Image Codecs Comparison (September 2005)
- First Annual MPEG-4 AVC/ H.264 Video Codecs Comparison (January 2005)
- Second Annual MPEG-4 AVC/H.264 Video Codec Comparison (December 2005)
- Subjective Comparison of Modern Video Codecs (February 2006)
- MPEG-2 Video Decoders Comparison (May 2006)
- WMP and JPEG2000 Comparison (October 2006)
- Third Annual MPEG-4 AVC/H.264 Comparison (December 2006) (All versions for free!)
- Lossless Video Codecs Comparison 2007 (March 2007)
- Fourth Annual MPEG-4 AVC/H.264 Comparison (December 2007) (All versions for free!)
- Options Analysis of MPEG-4 AVC/H.264 Codec x264 (December 2008)
- Fifth MPEG-4 AVC/H.264 Comparison (May 2009) (All versions for free!)
- Sixth MPEG-4 AVC/H.264 Comparison (May 2010)
- Seventh MPEG-4 AVC/H.264 Comparison (May 2011)
- Eighth MPEG-4 AVC/H.264 Comparison (May 2012)
- Ninth MPEG-4 AVC/H.264 Comparison (Dec 2013)
- Tenth Video Codec Comparison (HEVC) (Oct 2015)
- Eleventh Video Codec Comparison (HEVC) (Aug 2016)
- Twelfth Video Codec Comparison (HEVC) (Aug 2017)
- Thirteen Video Codec Comparison (HEVC) (Aug 2018)
- Fourteen Video Codec Comparison (HEVC) (Sept 2019)
- Cloud Encoding Servoces Comparison 2019 (Dec 2019)
- Fifteen Video Codec Comparison (HEVC) (Dec 2020)
- Sixteen Video Codec Comparison (Dec 2021)
- Seventeen Video Codecs Comparisons (Nov 2022)
- Eighteenth Video Codecs Comparisons (Apr 2025)
- Nineteenth Video Codecs Comparisons (2025)
- Codec Analysis for Companies:
Other resources
Video resources:
Server size: 8069 files, 1215Mb (Server statistics)
Project updated by
Server Team and
MSU Video Group
Project sponsored by YUVsoft Corp.
Project supported by MSU Graphics & Media Lab